Can we create bar graphs and charts in UiPath?
Hi @new_user
You can create bar graphs and charts in excel using the data through uipath. You can use excel related activities to get the data prepared in excel sheets. Then you can use short cut keys though not key activities to navigate to charts option in excel and create graphs.
I have done this couple of times with excel using uipath…
1 Like
Hi @new_user
Yes of course, we can create using MACROS in excel option
its like how we record the navigations in the excel with this macro option
Hope these steps could help you resolve this
–here in uipath we got an option called INVOKE VBA, activity
–once the macro is recorded and obtained as a vb script, copy that and paste in a text file (.txt)
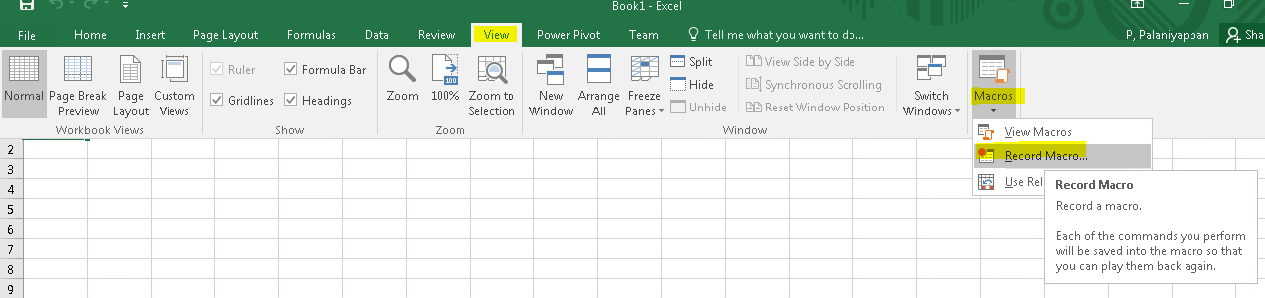
–once after performing creation of chart, click on the record stop button so that macro will be created (that pause button will be there only when we click on record macro)

–now go to same drop down option inthe macros and click on view macro and click edit and copy that vb code and paste it in a text file (.txt)
–mention that .txt file path as input to this INVOKE VBA activity along the property code file path
–mention the method name of the vba code in the property entry method name in string type (“Main”) or (“Macro1”)
–if any parameter are to be passed to the code then mention that in the enter method parameters in list type
–Then make sure that this invoke vba is kept inside a excel application scope activity and pass the file path as input to that activity
For more details and a example on the INVOKE VBA activity
EDIT: this could help as a component
https://go.uipath.com/component/balareva-xl-activities
Kindly try this and let know for any queries or clarification
Cheers @new_user
4 Likes
Yes you can. Use BalaReva.Excel.Activities package to do this. Please check below thread for your reference.
6 Likes
i’m not well versed with VBA
No worries
We don’t need to write vba
We can get that from excel itself
We got an option called Record Macro
Cheers @new_user
2 Likes
I’ll check it now. Thank you! ![]()
1 Like
Great
Cheers @new_user
1 Like
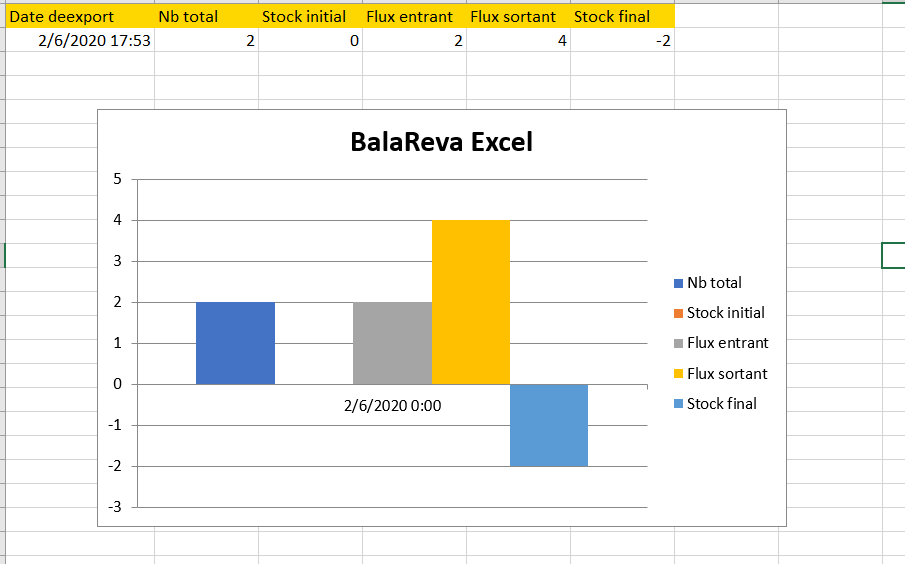
Hi, I just want to create a column chart from my Excel data. But it doesnt work. Do I have forgotten something to fill ? Thank you. Here is a picture of my Excell datas and UI Path column chart infos. Thank you for your help !!! ![]()

Yes ! here is the excel file that I want to transform in a column chart. Thank you very much for your help ! Sample.xlsx (8.7 KB)
1 Like
Hi @lulu75,
This is the output… Use the latest version which i have attached it in the below.
Regards
Balamurugan.S
1 Like
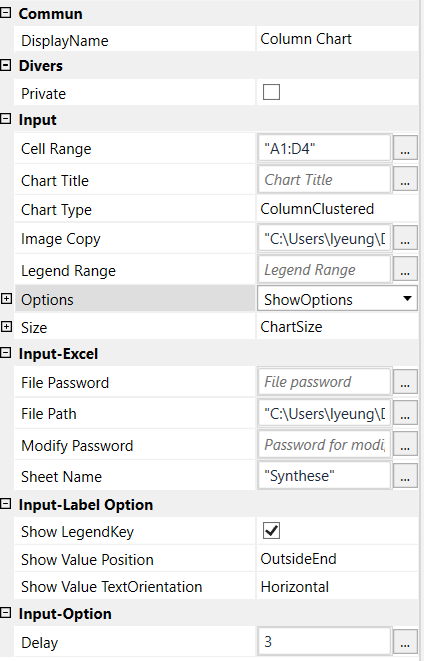
Yes, I can do it manually too. But how did you do it on UI Path ? What have you written inside the Activity fields ? I already use Balareva for Excel, that’s why I’ve asked for help cuz it doesnt work : I don’t know how to do it… Can you please send me a picture of the fields for Activity ColumnChart, so that I see what I missed. Also, there is only ColumnChart Activity to get in my Sequence ? Or does it need something else ?
1 Like
Hi @lulu75,
Download the package from this link.
https://forum.uipath.com/uploads/short-url/pW0lzbZkyg9sEl3aWPDE6ayPmSu.nupkg
Configure it as mentioned in the below video.
and install the package…
Regards
Balamurugan.S
1 Like
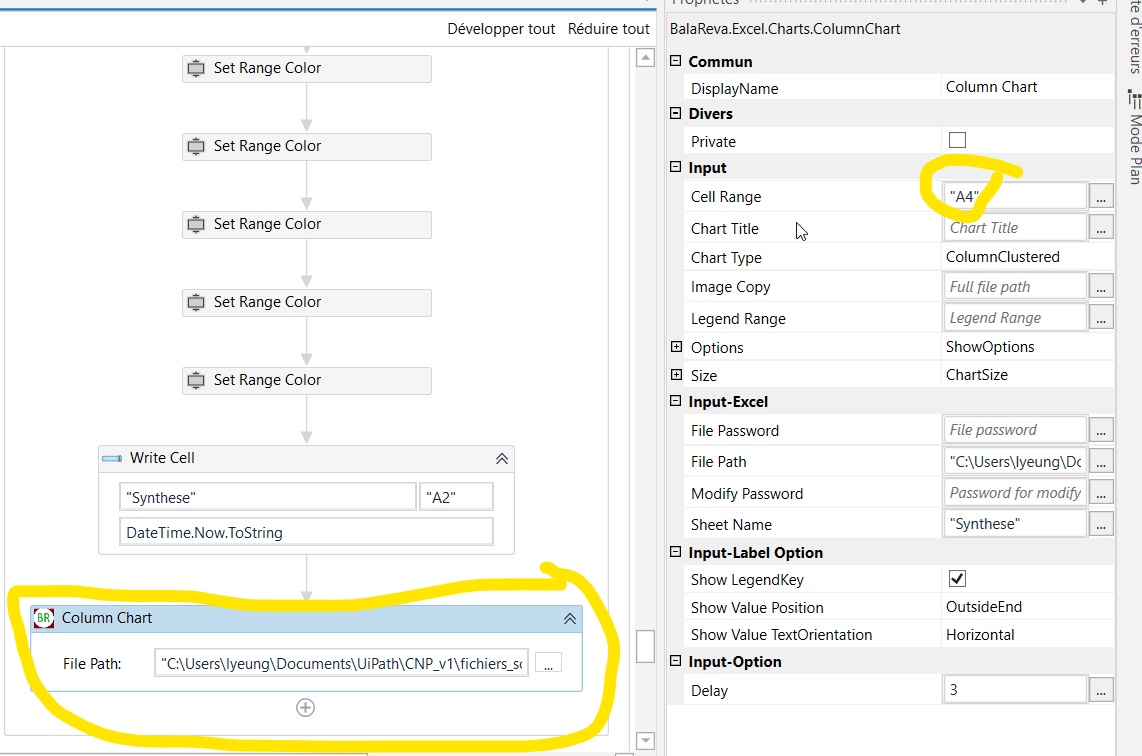
Yes thank you ! it is now the last version of BalaReva. So I put the Activity “Colum chart” inside my Excel Application scope". Then here are the details so that the column chart works, but I have a message error that tells “The index is outside the limits of the table”… Which cell range did you write ? Can you show me what did you write inside the Activity Column charts specifications ? That’s crazy it doesnt work… thank you. OR maybe there is something more to do?! ![]()
![]() Thank you so much
Thank you so much
1 Like
Hi @lulu75,
The Range should be begin and end like “A1:J10” . Change the Cell Range. It will work.
Thank you
Balamurugan.S
1 Like
Thank you, it is done. But UI Path tells me “The object reference is not defined to an instance of an object.”

1 Like
Are you using inside excel application scope ? Better can you send me the xmal and excel by message…
Regards
Balamurugan.S
1 Like
Well, I know what was the problem : I use Column chart activity from BalaReva. But only “ColumnClustered” charType works. When I want to select 3D columns as CharType, it doesn’t work…
How weird because I only want to change the charType…
1 Like
Hi @lulu75,
Let me check and ping you!!