Hi All,
Good Morning
i have a task and want to automate it, please could you help me to automate this task
filter data from text file (as attached text file “xxxxxxxxxx123456.log”)
Head #06 GLOBAL TIME= 20025ms, PERSO=18216, SERVER= 1809ms, (i want Filter data from log txt file this format)
save filter data into another txt file (given Name xyz)
This was an interesting request! Although I have a solution for you, I suggest you review it. I may have not documented all steps. I wanted to show one way of solving this.
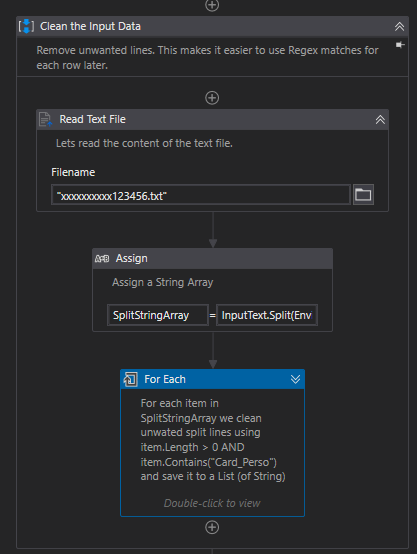
First we need to clean the data. We can do that by first reading the log file contents and using InputText.Split(Environment.NewLine.TocharArray) this results in an array
Next we iterrate through the array and look for lines where we can see some transaction and where the item is not empty string (newline charcter ) i.e., item.Length > 0 AND item.Contains("Card_Perso") and save it to a List (of String) We save the ouputs to a list
We clear outputs from the new log file (we do this so that every run has a new temporary log file)
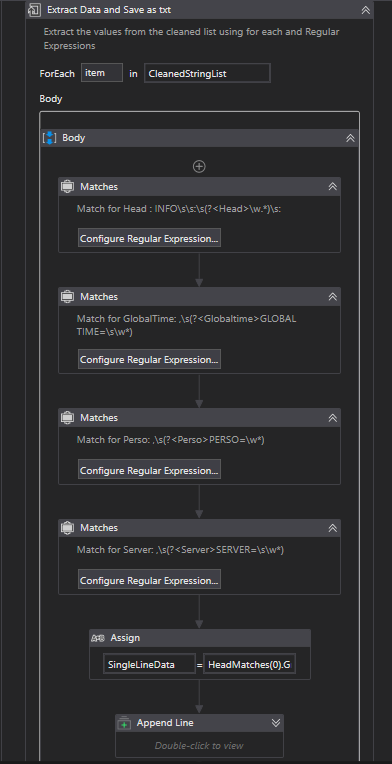
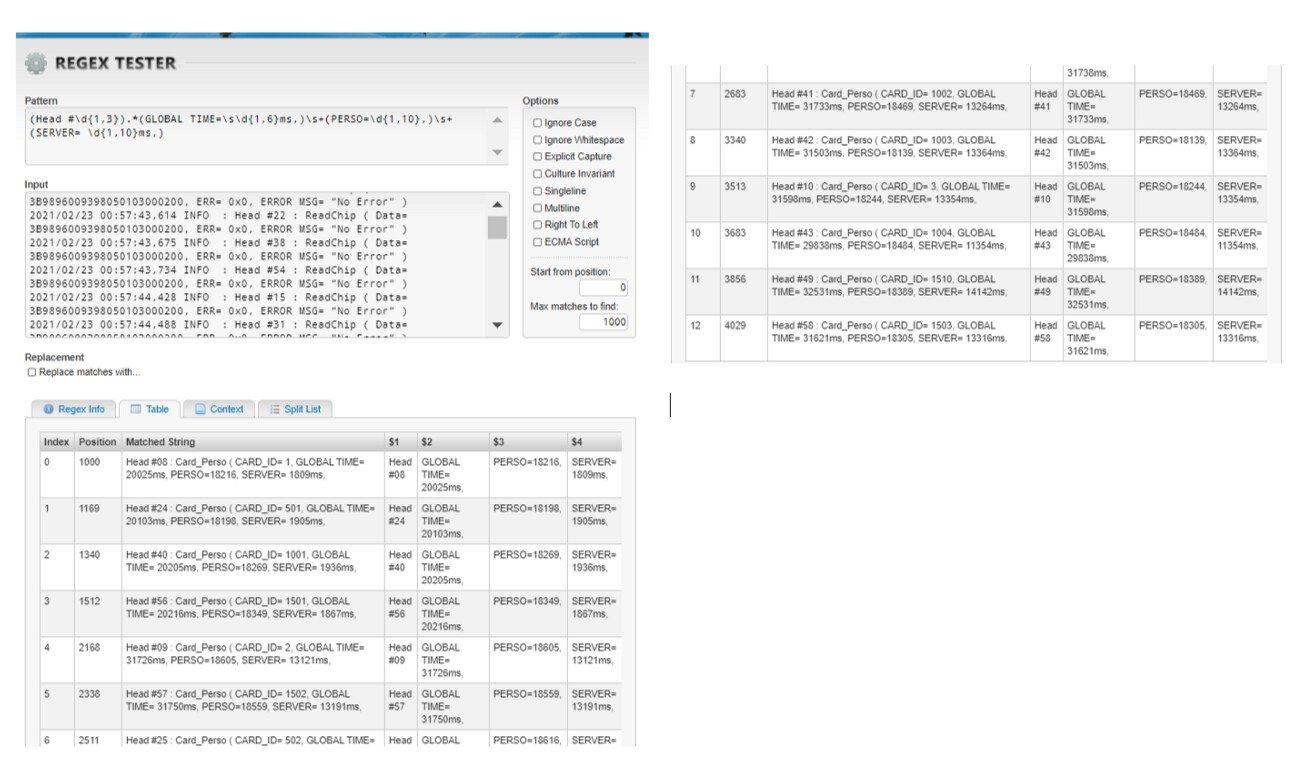
We iterate through the list from Step 2. We know each item in the list is a entire line from the Input log file so we can then use Regex to match values so as to get the desired format of log
This will return a formatted text file : Head #06,GLOBAL TIME= 20025ms,PERSO=18216, SERVER= 1809ms
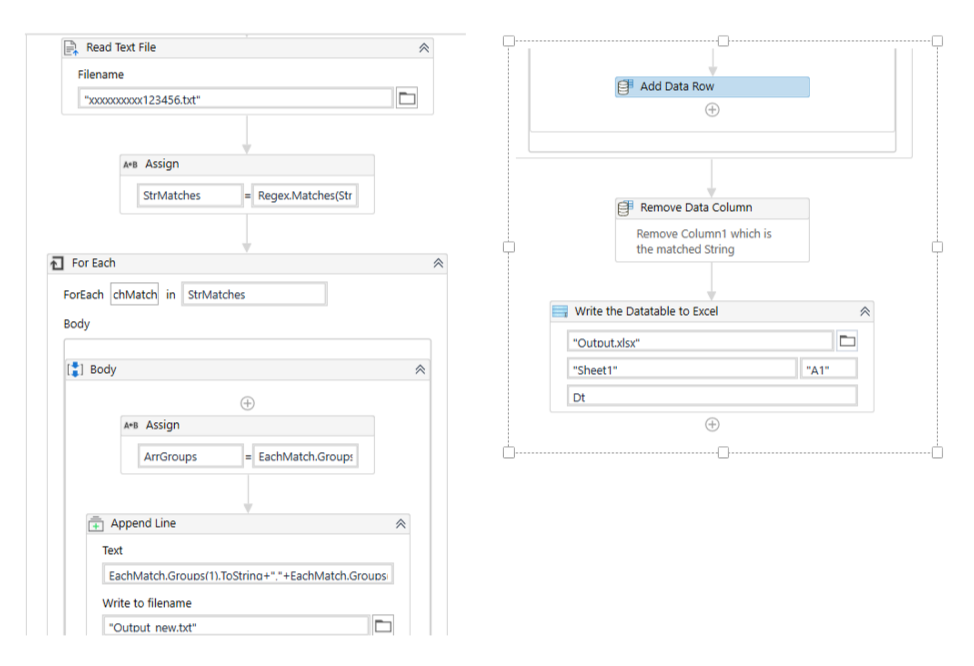
We now can convert the results from Step 4 (new formatted log file) to excel. But to do that we first have to define a datatable and extract only the values of the cateogries for example Head #06 → Head as Column name and 06 as value
We use the same .split method on newline charcter to extract an array of strings, on which we can use regex. The output from regex will give you values to be added to the Datatable we built in Step 5 using add data row. Finally outside the for each loop we use write range to make an excel file
Phewww that was a lot of manipulation, we have one last thing to do is to make a line chart.
For this its best to not reinvent the wheel so, lets use the very usefull charting library from @KanadMehtaChart Image Generator - RPA Component | UiPath Marketplace . This library lets us customize a lot of properties and save the chart as an image file. It also supports many differnt types of charts. Cheers to @KanadMehta !
We first read the generated excel file from Step 6, and use the Generate Chart Image activity
Since we are interested in only some of the values (your question did not mention on which variables you need line chart)