And I would like this two to be added to become like this (color as a guide).
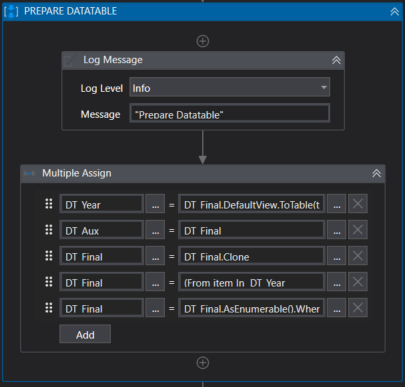
The input datatable is limitless. It can be only 1 or 3 or 12. Each datatable is in for each loop. dt_1 is in the first loop and dt_2 is in the second loop.
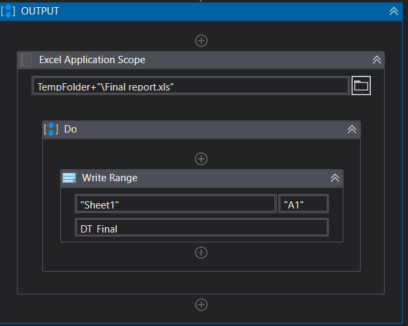
Read all the excel and merge them into one datatable.
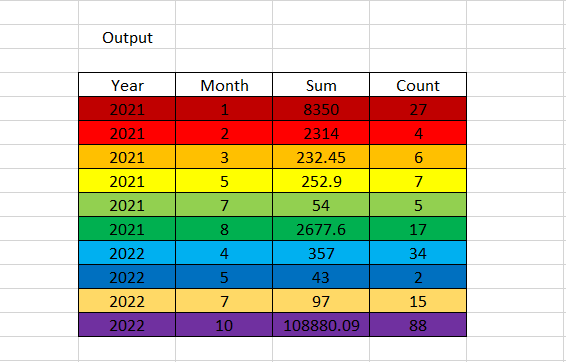
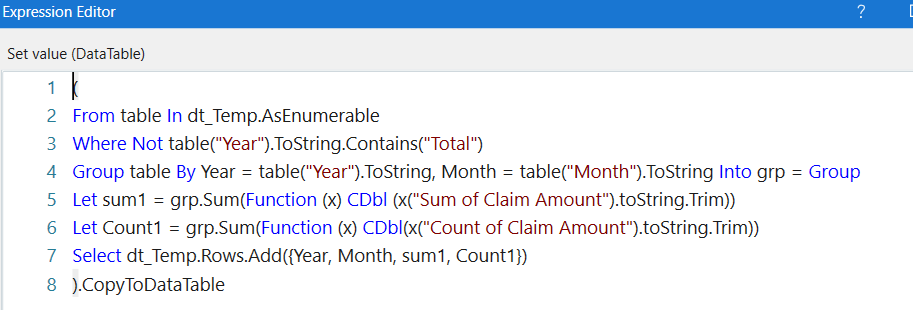
using linq you can get the required sum and count as per year and month.
Linq to get the sum and count
(From table In dt1.AsEnumerable
Where Not table(“Year”).ToString.Contains(“Total”)
Group table By Year = table(“Year”).ToString, Month = table(“Month”).ToString Into grp = Group
Let sum1 = grp.Sum(Function (x) CDbl (x(“Sum”).toString.Trim))
Let Count1 = grp.Sum(Function (x) CDbl(x(“Count”).toString.Trim))
Select dtFinal.Rows.Add({Year, Month, sum1, Count1 })
).CopyToDataTable
Attaching the example with two datatables here ExcelSUm.xaml (10.8 KB)
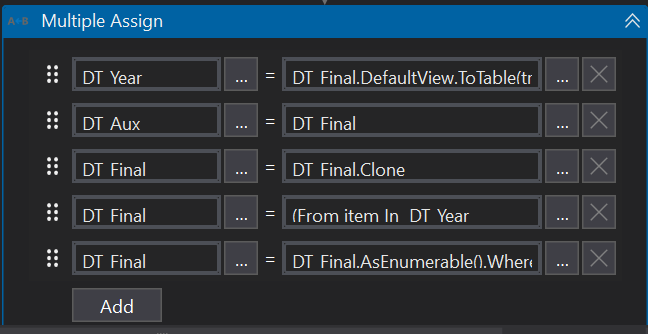
@Pamela_Sibaja I followed your method for the merge, but I currently have 1 input datatable only. Somehow the value duplicated two times. But it shouldn’t since I only have 1 input datatable. dt_Temp is an empty datatable just like your dt_Final.
For example. Year 2021, Month 6, Sum 100, Count 2 become Year 2021, Month 6, Sum 200, Count 4 outside the for each loop. Then it became Year 2021, Month 6, Sum 400, Count 800 after linq.
You can use an if activity to validate if there are many files in the folder that you can merge, but if it’s just one you can continue with my example code and it will work fine.
Hi @arina ,
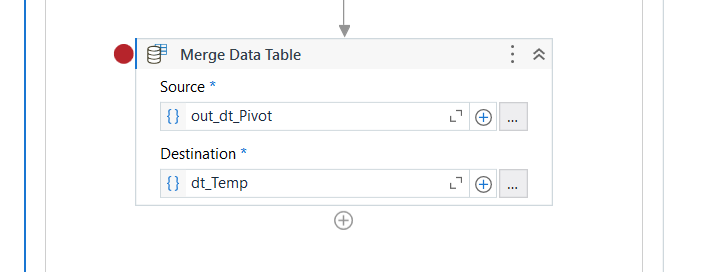
Where you wrote Let out_dt_Pivot should be Let DT_Temp, because I’m creating a new datatable where I pull the Unique values from the datatable to compare DT_Aux values and combine lines and add equal values based on Year and Month column in DT_Temp to add to DT_Final which for you would be out_dt_Pivot.