Monitoring: Queues overview

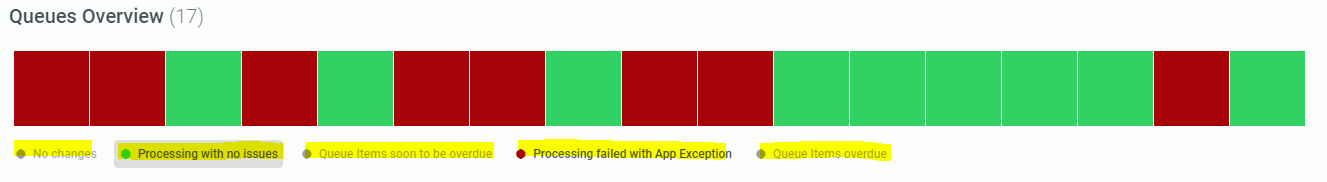
After upgrading our orchestrator, we now have this new queues overview available. I think it could be valuable. However, right now almost all queues are red. Some of them might have had an application exception within the last 24 hours (interval is set to 1 day), but definitely not all of them.
What is triggering that it shows up as red, that the queue have had just a single application exception within 2 years or that it have had a business exception?
Should it not follow the interval that is by default 1 day?
If I change the interval to 1 hour, then I know for sure that some of the queues that are red did not process anything in that period, so it should not be red.

The documentation is not explaining this very well: https://docs.uipath.com/orchestrator/docs/queues

In short. What is triggering the red color?

1 Like

have you figure out what causing the issue?

No, unfortunately not. Which makes the monitoring feature useless.

Please try the following steps:

  1. Logon to your orchestrator
  2. Navigate to queues-overview
  3. Filter for the queue
  4. View Transactions
  5. Set the filters: status=failed | revision=none | exception=application
  6. Select the queue item(s)
  7. Click on ‘Mark as verified’
  8. The queue should be green now in the monitoring

If you make sure that only verified items are in the queue after they have been finalized, you can make sure that the operations have been properly processed or rightly outsourced.
If you and your colleagues clean up once, monitoring can be quite helpful for the RPA controller.

Another tip: In the monitoring view (and other views) you can select or deselect the options highlighted in yellow in the screenshot.

2 Likes

This topic was automatically closed 3 days after the last reply. New replies are no longer allowed.