Hi Everyone,
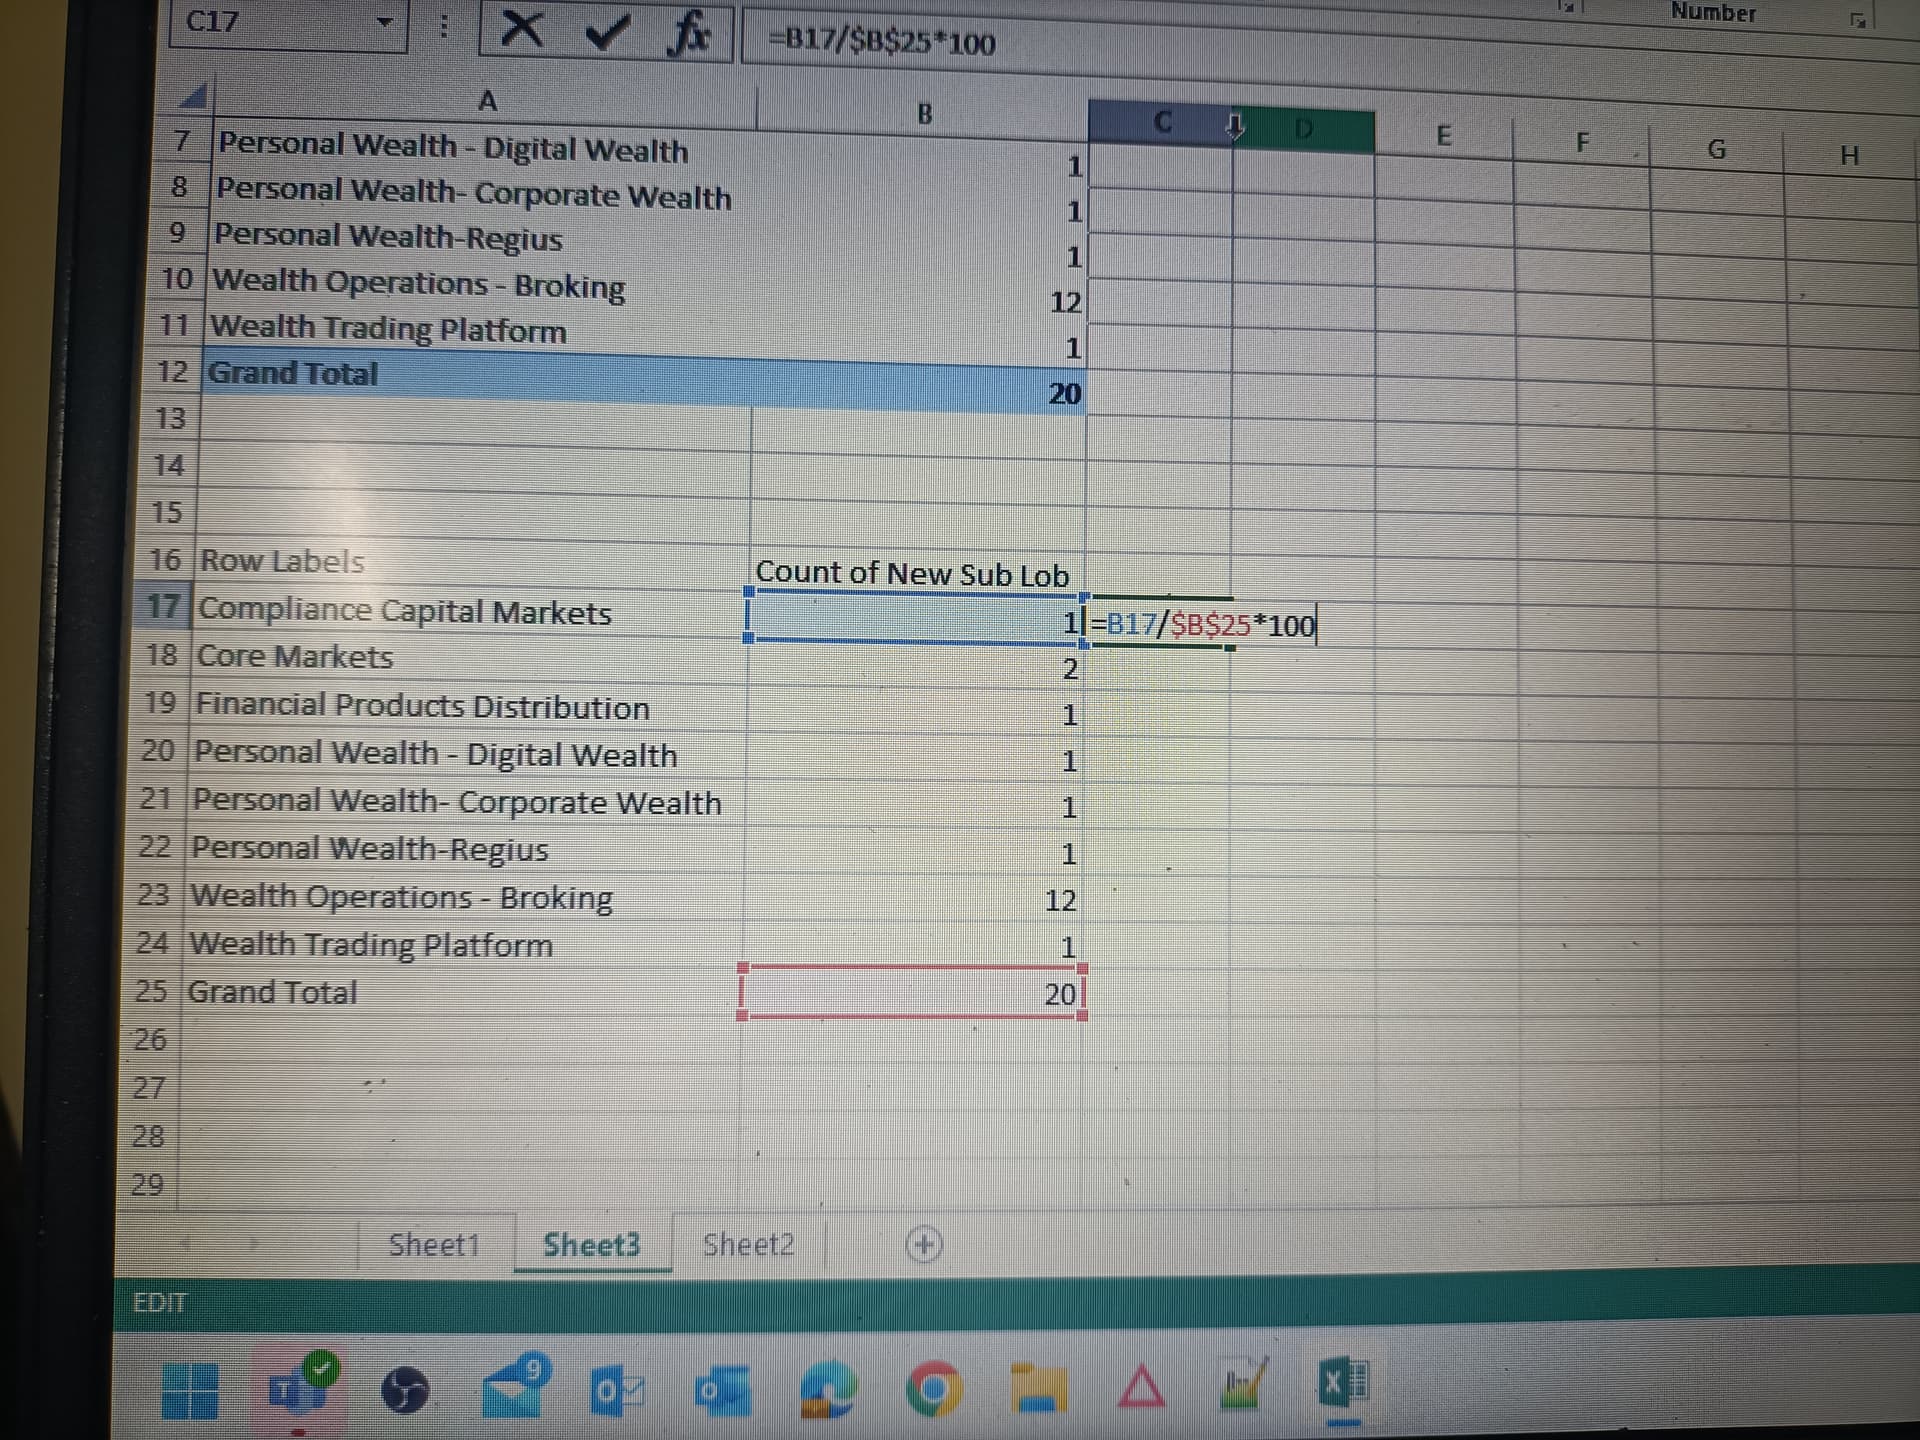
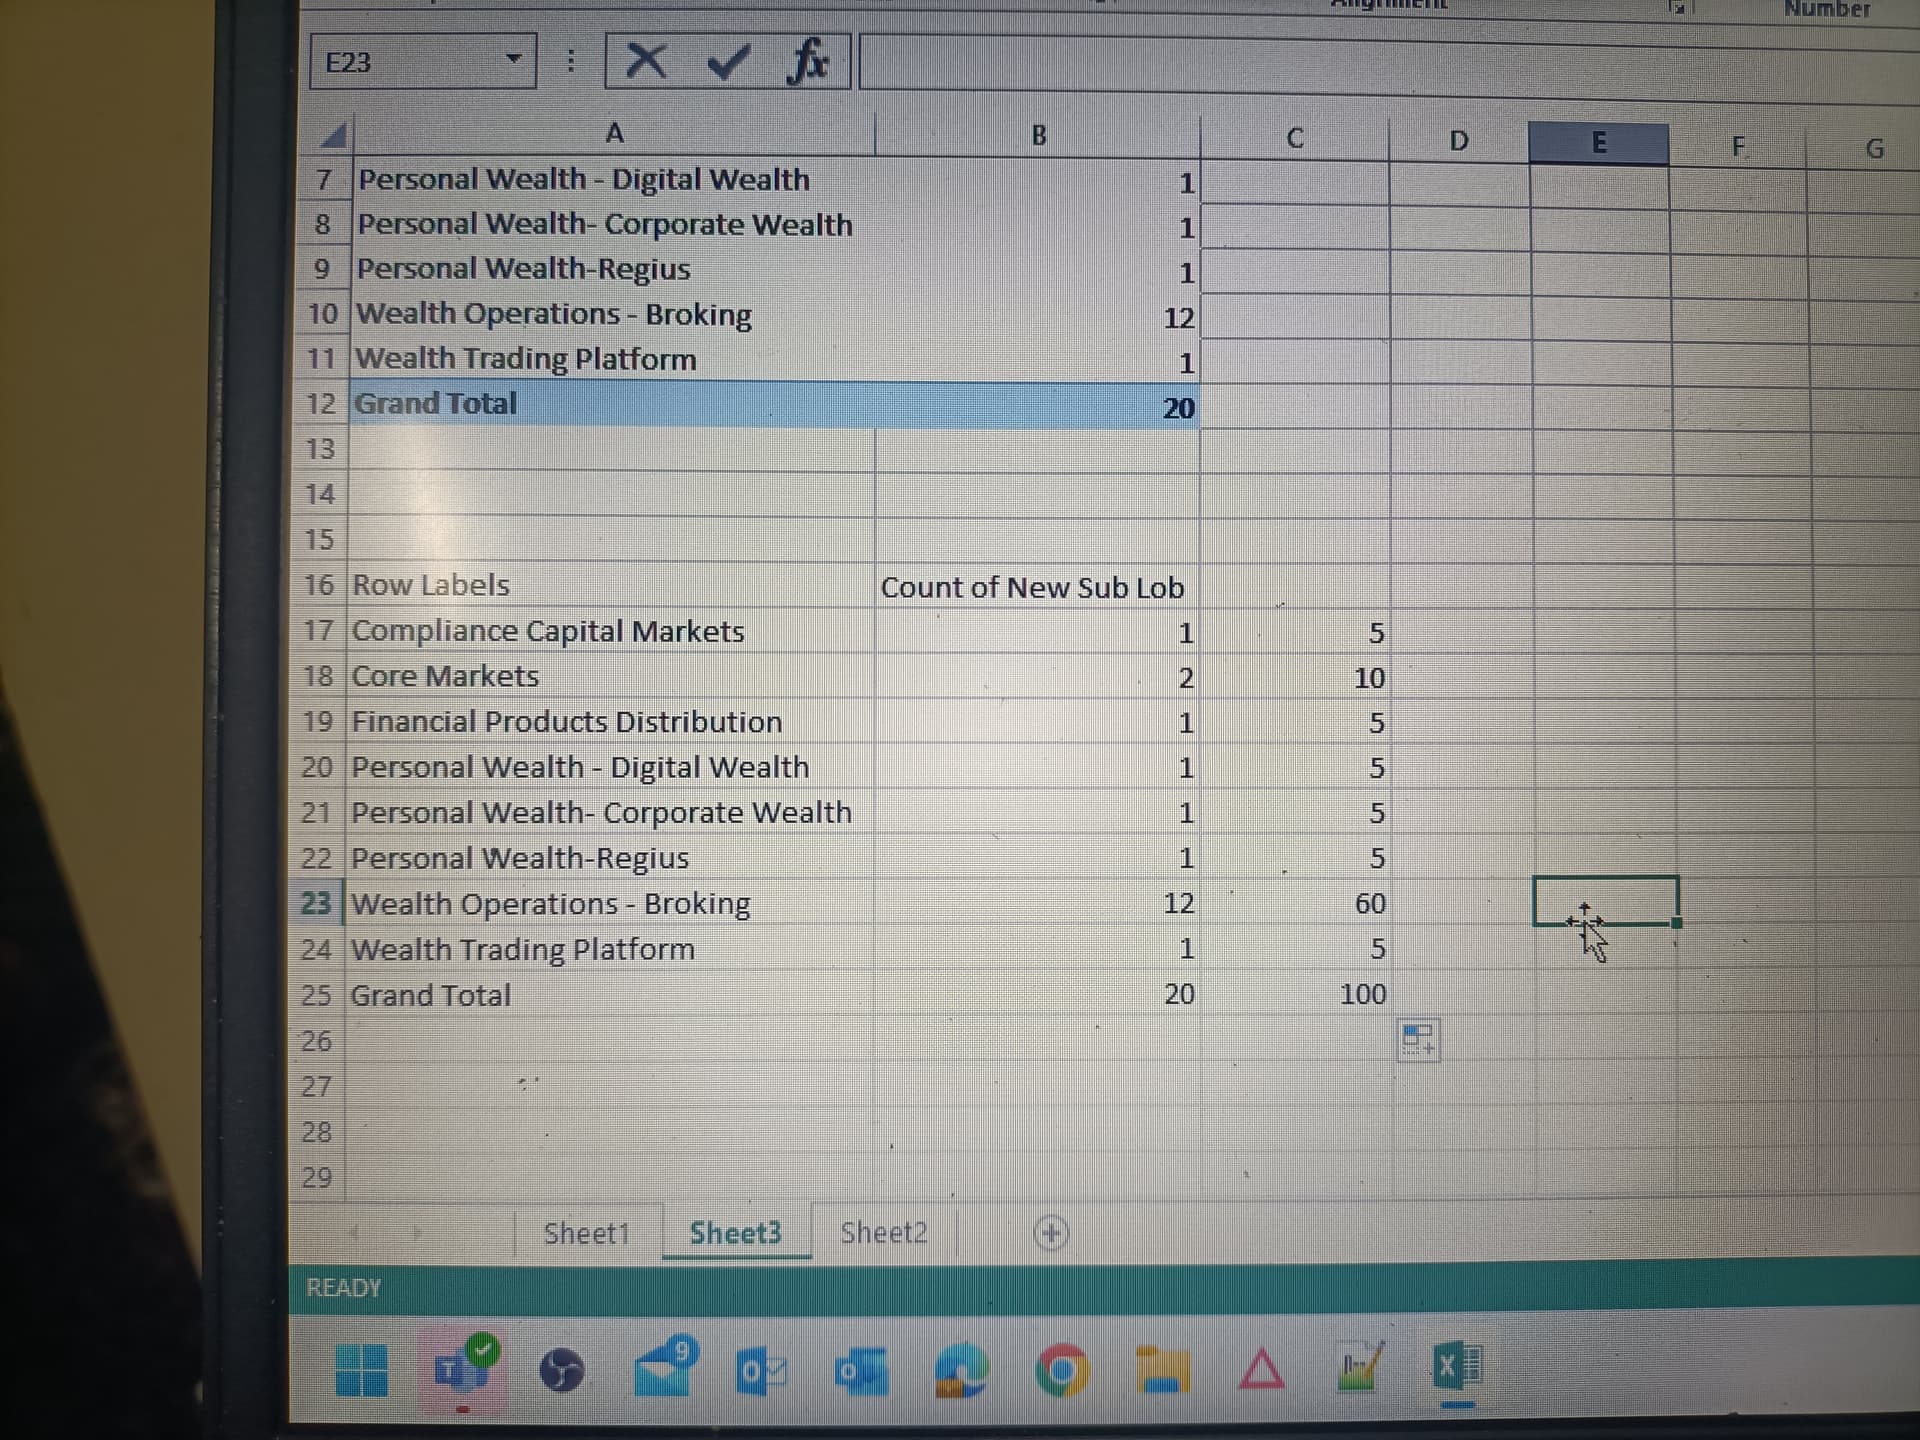
I have to create pivot table without using excel so basically i have to get count of total same po number and new sub lobs get count of duplicate sub lobs/total po number *100
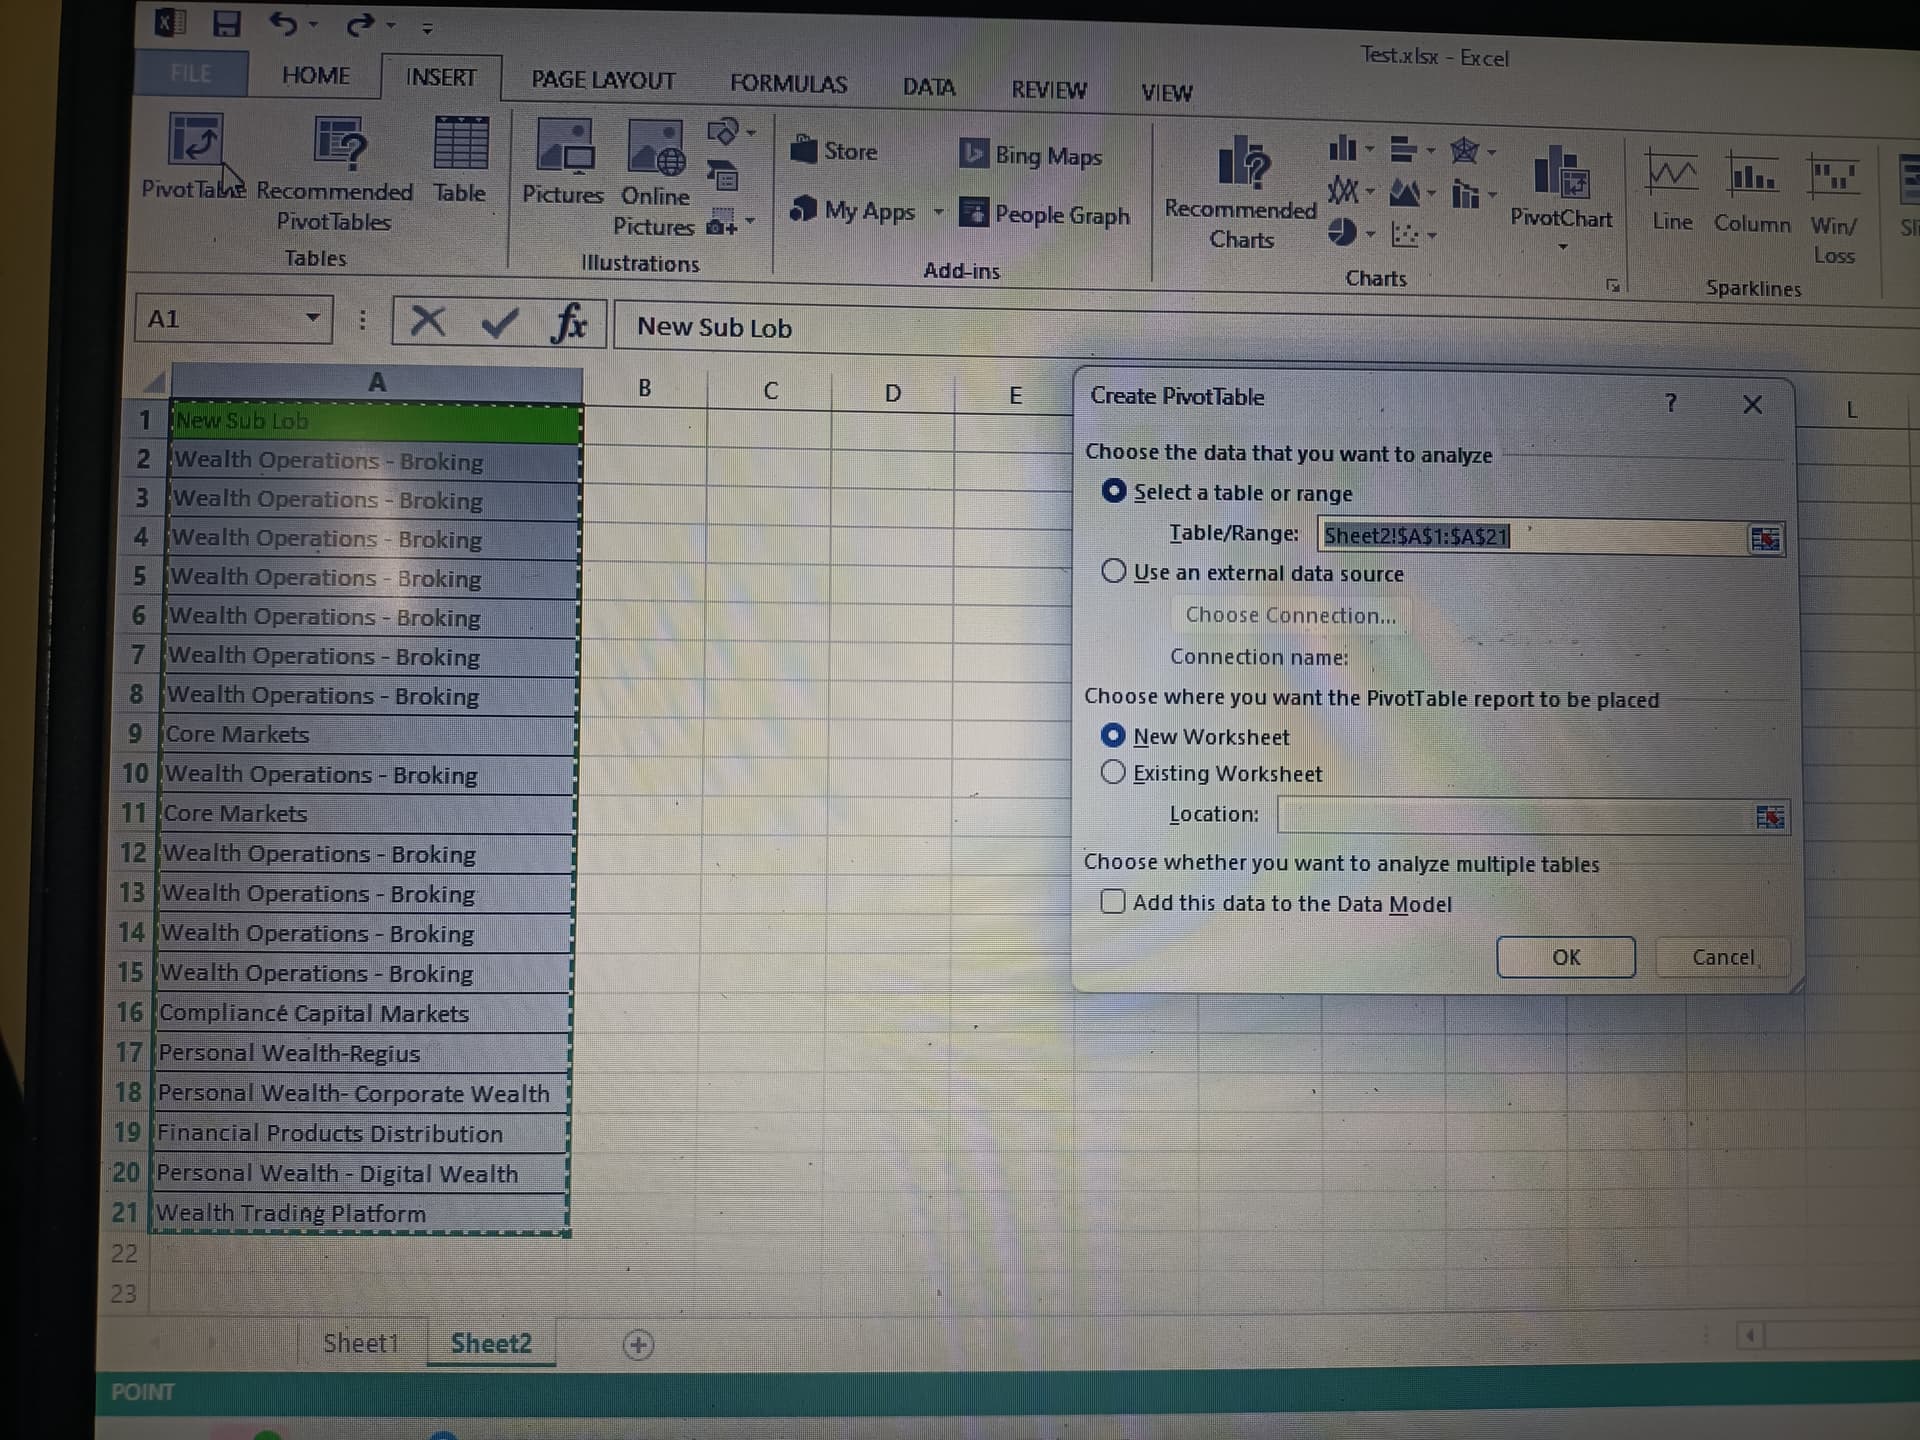
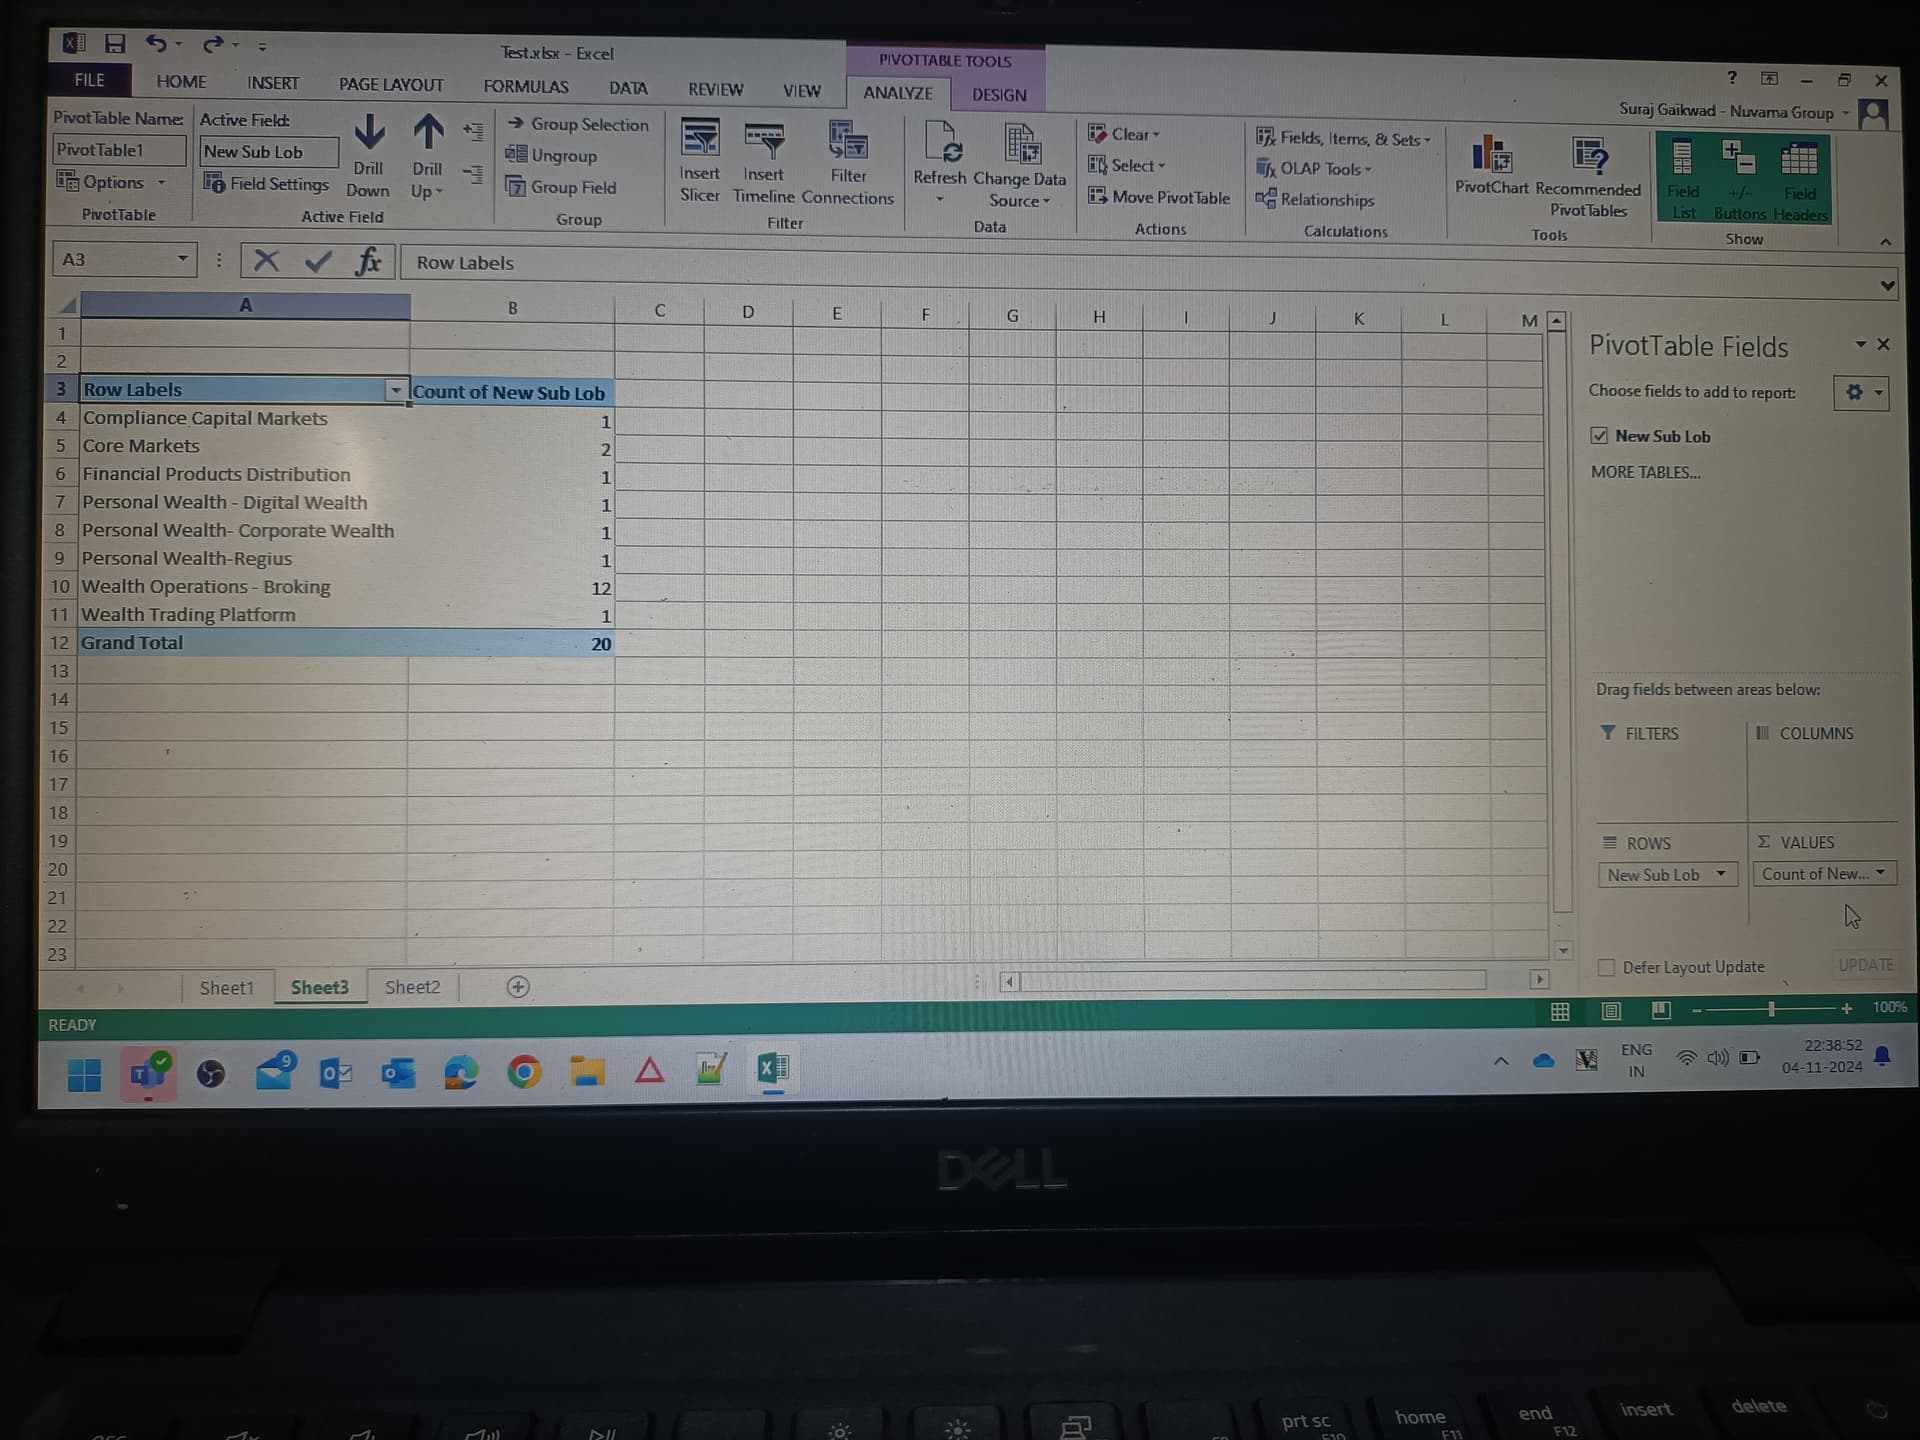
Blow steps of how I’m using pivot table m
input Dt
 x(0).ToString).Select(function(x) newdt.LoadDataRow({x.Key,cdbl(x.Count),(x.Count/dt.RowCount)*100},False)).CopyToDataTable
Hope this helps
Cheers
@Anil_G
Giving error and which i used already in second code but I’m not able to extract row by row data
Thanks
Anil_G
November 4, 2024, 6:22pm
4
@suraj_gaikwad
You just write select(function(x)) which does not even make sense…please use the proper code given above
Cheers
@Anil_G
Hi
What is the data type of newdt bcz it’s showing error
@Anil_G
Hi
Newdt = dt.AsEnumerable.GroupBy(function(x) x(0).ToString).Select(function(x)
This is not able to add in data table
We can do with activity it will take time. I have filter of every po number transaction then i have to create pivot table
@Kismet_Tosun
Thanks
Anil_G
November 5, 2024, 9:20am
10
Anil_G:
Newdt = dt.AsEnumerable.GroupBy(function(x) x(0).ToString).Select(function(x) newdt.LoadDataRow({x.Key,cdbl(x.Count),(x.Count/dt.RowCount)*100},False)).CopyToDataTable
Why are you giving only till function(x) …the above one is the full expression…please use the full expression
Cheers
Hi @Anil_G
I got the output but not as i looking
This output is coming
I’m looking output like
Second table
Then i have to get one value form pivot table
Thanks for the response
Anil_G
November 5, 2024, 10:03am
12
@suraj_gaikwad
Please share input and output in an exce
Cheers
Hi @Anil_G
I have attach file for reference
challenge (1).xlsx (16.6 KB)
So basically i have done only for single PO which i mentioned in sheet
Thanks
Hello @Anil_G @Kismet_Tosun
Any solution found.
Thanks
Anil_G
November 7, 2024, 10:14am
16
@suraj_gaikwad
Tried lookign at the sheet…not sure which is input which is ouput
can you please give only two sheet will try to figure from there and name them input and output
Or happy to connect you can send an invite
cheers
Anil_G
November 7, 2024, 4:17pm
18
@suraj_gaikwad
looks liek you need this for each po
then you need to first loop based on po and then inside loop can get each pivot using above formula
for loop with Maindt.AsEnumerable.GroupBy(function(x) x("PO Column").ToString)
Inside loop currentitem.key will give the po column value and currentitem.GroupBy(function(x) x("Status Column").ToString).Select(function(x) newdt.LoadDataRow({x.Key,cdbl(x.Count),(x.Count/currentitem.Count)*100},False)).CopyToDataTable
type argument in for loop should be
Hi @Anil_G
Output is coming right but i have to process for single single po not all at a time
For example
Once we get final output then get the value of New sub lob and Percentage then write on url
Then go for next PO number in excel1 then filter and create pivot table in excel two
Like this
Thanks.
Hi @Anil_G
This is working but i need to do on single po number basis
I’m getting po number from different invoice on that i have to do pivot
Thanks