I have an Excel File with Two Column and I want to Show That values in a PieChart ? But How ?
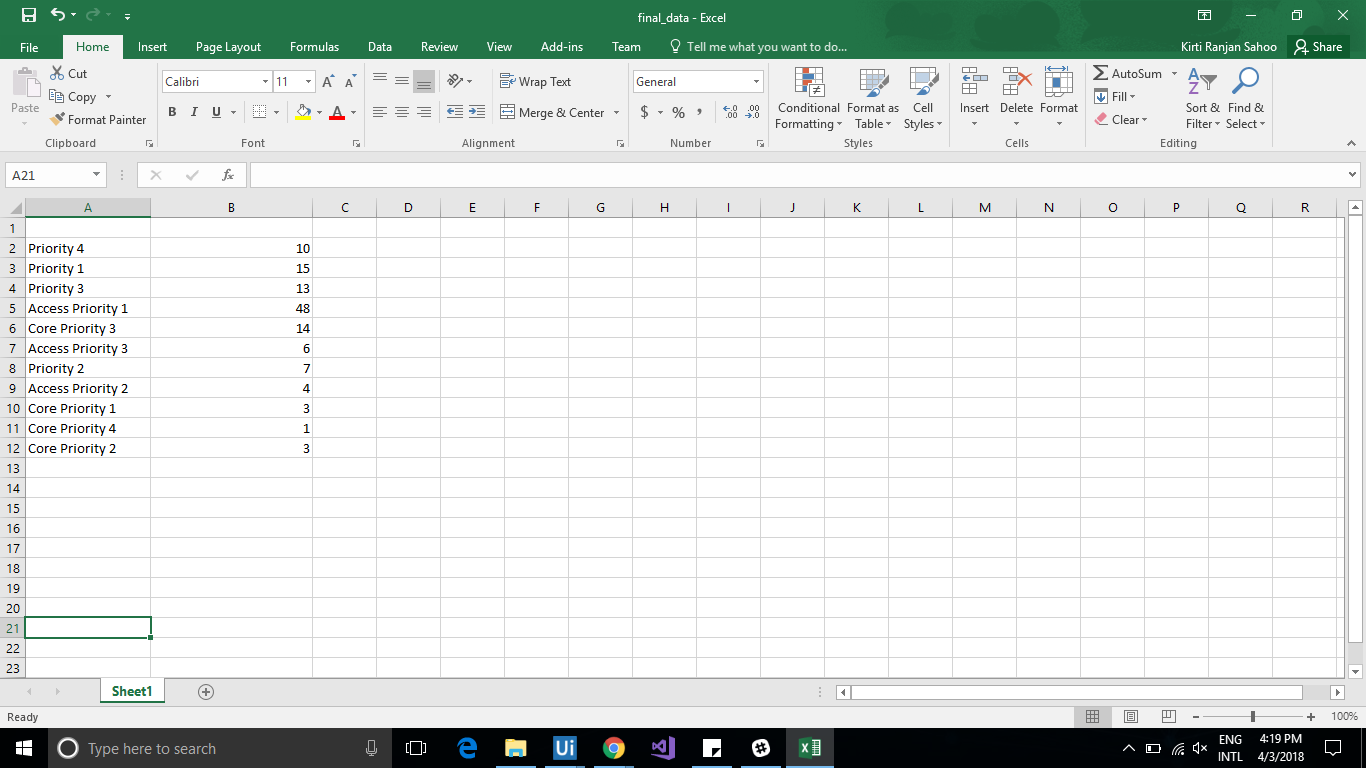
final_data.xlsx (9.0 KB)
I have an Excel File with Two Column and I want to Show That values in a PieChart ? But How ?
@kirtiSagar
In quick shot, have you tried macro to create the Pie Chart? You can invoke the macro in UiPath to create the pie chart.
Regards,
Balram
Hey,
Tried with a custom activity. Didn’t got much time to test all possible cases. But this should create a simple pie chart using the range from the excel file table.
CreateChartCustomActivities.1.0.1.nupkg.zip (7.6 KB)
Let me know if it works. ![]()
Thanks,
Rammohan B.
Using Invoke code
excel_pie.xaml (7.9 KB)
It’s really helpful.
Thanks & Regards,
Shreekrishna K Devasya
Are you running the same file? Based on the errors, looks like you have copied the code from Invoke code into new activity and forgot to create arguments. Please check “Edit Arguments” section.
Hi Vinay,
I want to specify that you need Excel installed on the machine in order to be able to open the xaml.
Correct. It uses Microsoft.Office.Interop.Excel to manipulate Excel and it doesn’t work without MS Office Installed.
Hello @vvaidya, I tried your code and the .xaml successfully run,
but there is no effect on the Excel file (no chart seen .
Anything I am missing or there are some requirements on Excel etc? (currently using Excel 2010 here).
Hi Kirti,
Following is a use case in which I have passed the hot key and created a normal graph. Same way you can try for pie chart or record other sequences for converting data to pie chart.
1.Send Hot Key Ctrl + a for selecting whole spreadsheet values
2.Send Hot Key Alt + F1 for creating a graph.
Using this basic graph will be created, you can modify the style of graph after that.
Can u Upload Your .xaml File ?
No Sir, I ll Update It As Per My Requirement but Same Error ?
Same Here…
Hi @kirtiSagar, I successfully ran the code eventually.
The code contains Try and Catch so if there is some error we don’t get notified by it, how about dropping the Try Catch to see if it throws any error?
Hi Guys, Maybe I am late in replying, however, I find the solution to the problem rather simple.
Steps
1. Drop activity Excel Application scope  (Choose your file)
2. Select the range of data
3. Click activity on "Insert" tab (remove unnecessary auto-generated selectors)
4. Click on pie chart drop down (remove unnecessary auto-generated selectors)
5. click on 2-D pie (remove unnecessary auto-generated selectors)
6. Send hotkey Ctrl+s
Voila, the chart is there. This shall work with Excel 2017.
Now see another simpler way
1. Drop activity Excel Application scope  (Choose your file)
2. Select the range of data
3. Send hotkey combination: Alt + N + Q + enter
4. Send hotkey combination: Ctrl + s
In RPA sometime solution of a problem is not in programming always try to mimic user first then start thinking about inserting code.
PS: Now the solution has been uploaded, please change path of the file, as per your system.
MakeChart.xaml (14.9 KB)
Thx
~RPA Ninja
Hi Rpatech.
Please use the above excel file(final_data.xlsx) and upload the .xaml file here. Thank you .
Hi Kirti,
I am not able to upload the solution. Getting error “New user can not upload attachment”. I have solution for Normal bar graph and Pie chart both.
Done. Please check.

