Hi there, hope you’re doing well 
I come with a question/Use case when building an App in the new VB framework.
Description:
Example:
Let me picture you an example:
Imagine I have 6 invoice lines coming from the output of my process:
| customerName |
InvoiceNumber |
Amount |
Pending |
| ACME |
B21 |
200 |
200 |
| INC |
C54 |
100 |
50 |
| ACME |
B23 |
300 |
200 |
| INC |
C55 |
20 |
20 |
| ACME |
B25 |
200 |
100 |
| ACME |
A64 |
100 |
0 |
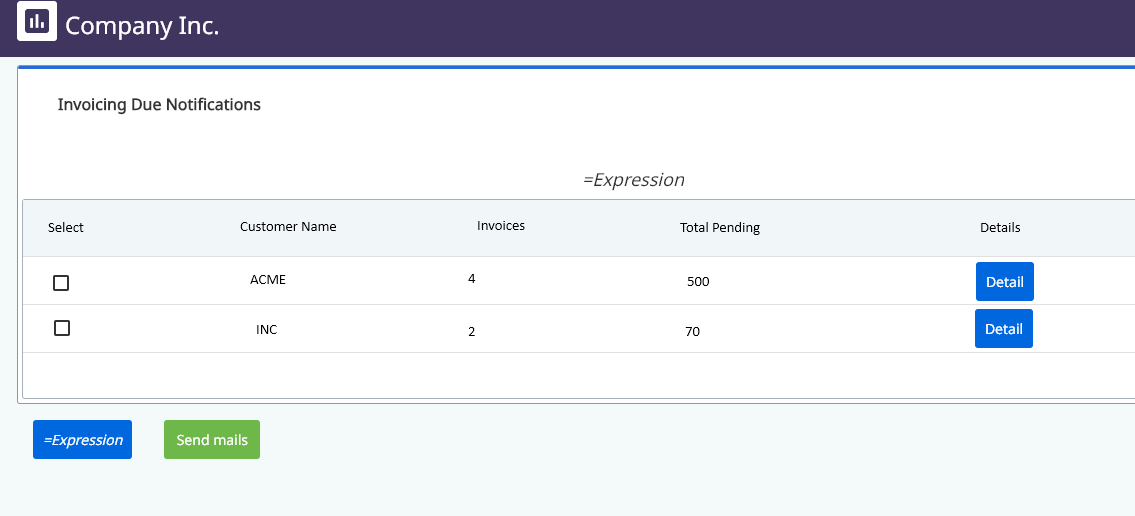
I would like to group them by clientName, count the invoiceNumbers and show the total pending amount. Then I would like to add for every row a [VIEW] button to see the details and a [checkbox] to be checked in case I want to notify this customer after. It would look like:
| Notify |
customerName |
invoices |
Total pending |
Detail |
| [checkbox] |
ACME |
4 |
500 |
[VIEW] |
| [checkbox] |
INC |
2 |
70 |
[VIEW] |
Conclusion:
I’ve managed to bind the data and I can print the table but I don’t see where I can filter/arrange rows and where I can add buttons/checboxed dinamically, here some pictures:

I imagine I cannot add a checkbox in “Source” field 
I hope this doesn’t go too out of the box and it helps someone else as well in the future.
Thanks in advance for reading
Any help will be very appreciated,
Hug!
BTW I think it would be possible some workaround by using entities, in this use case I cannot because it is a workflow-triggered real-time attended automation linked to the App
I’ve managed to reorganize the datatable from the process by creating other variable and, thanks to the real-time communication with the App, I can let my process wait until I give it back the selected ones…
Now the question is, How can I manage to add a button and a checkbox in every row?
Hi, I just found the solution: Edit Grid
So, I’ve created a boolean column in my dt called “Notify” with default value = false
| Notify |
customerName |
invoices |
Total pending |
| [checkbox] |
ACME |
4 |
500 |
| [checkbox] |
INC |
2 |
70 |
Then, with the Edit Grid component, I’ve mapped the columns. Note at this point I’ve marked my “Notify” colum as a Checkbox type (and I renamed as “Select”)

Finally I created several fields to be updated when I select a row so, I get then the details.
Hope it helps someone in the future!
TIP: You can take a look on this demo video from @Arvind_Kumar1 (thanks btw )
Hug!
The provided conversation details a solution for displaying and managing customer invoice data within a UiPath App built using the new VB framework. Here’s a breakdown of the solution and its key points:
Problem:
- The user has a DataTable containing invoice information for multiple customers.
- They want to display a summarized and user-friendly view with the following features:
- Group invoices by customer name.
- Show total invoice count and pending amount per customer.
- Include a “VIEW” button for each customer to see details.
- Include a checkbox for each customer to select those for notification.
Solution:
-
Data Table Restructuring (Optional):
- The user initially mentions reorganizing the DataTable during the process to achieve the desired grouping. However, this step might not be necessary with the chosen approach.
-
Edit Grid Component:
- The core solution involves using the Edit Grid component within the UiPath App.
- An additional boolean column named “Notify” (renamed to “Select” later) is added to the DataTable with a default value of
false.
-
Mapping Data to Edit Grid:
- The columns of the DataTable are mapped to the Edit Grid control.
- The “Notify” column is configured as a Checkbox type within the Edit Grid settings.
-
Buttons and Checkboxes:
- By using the Edit Grid, buttons and checkboxes are automatically generated for each row based on the data and configuration.
- The “VIEW” button functionality needs to be implemented separately using appropriate activities based on your specific needs (not covered in the provided solution).
-
Selecting Rows and Updating Data:
- The user mentions creating additional fields to capture information when a row is selected. This allows for further actions based on user interaction with the checkboxes and “VIEW” buttons.
Additional Notes:
- The user acknowledges a helpful video from @Arvind_Kumar1 regarding Edit Grid functionalities, but the specific video link is not provided. You can search for relevant videos on UiPath Academy or YouTube.
Overall, this solution effectively leverages the Edit Grid component to achieve the desired user-friendly invoice summary with selection and notification capabilities within a UiPath App.