Main.xaml (7.8 KB)
python.zip (485 Bytes)
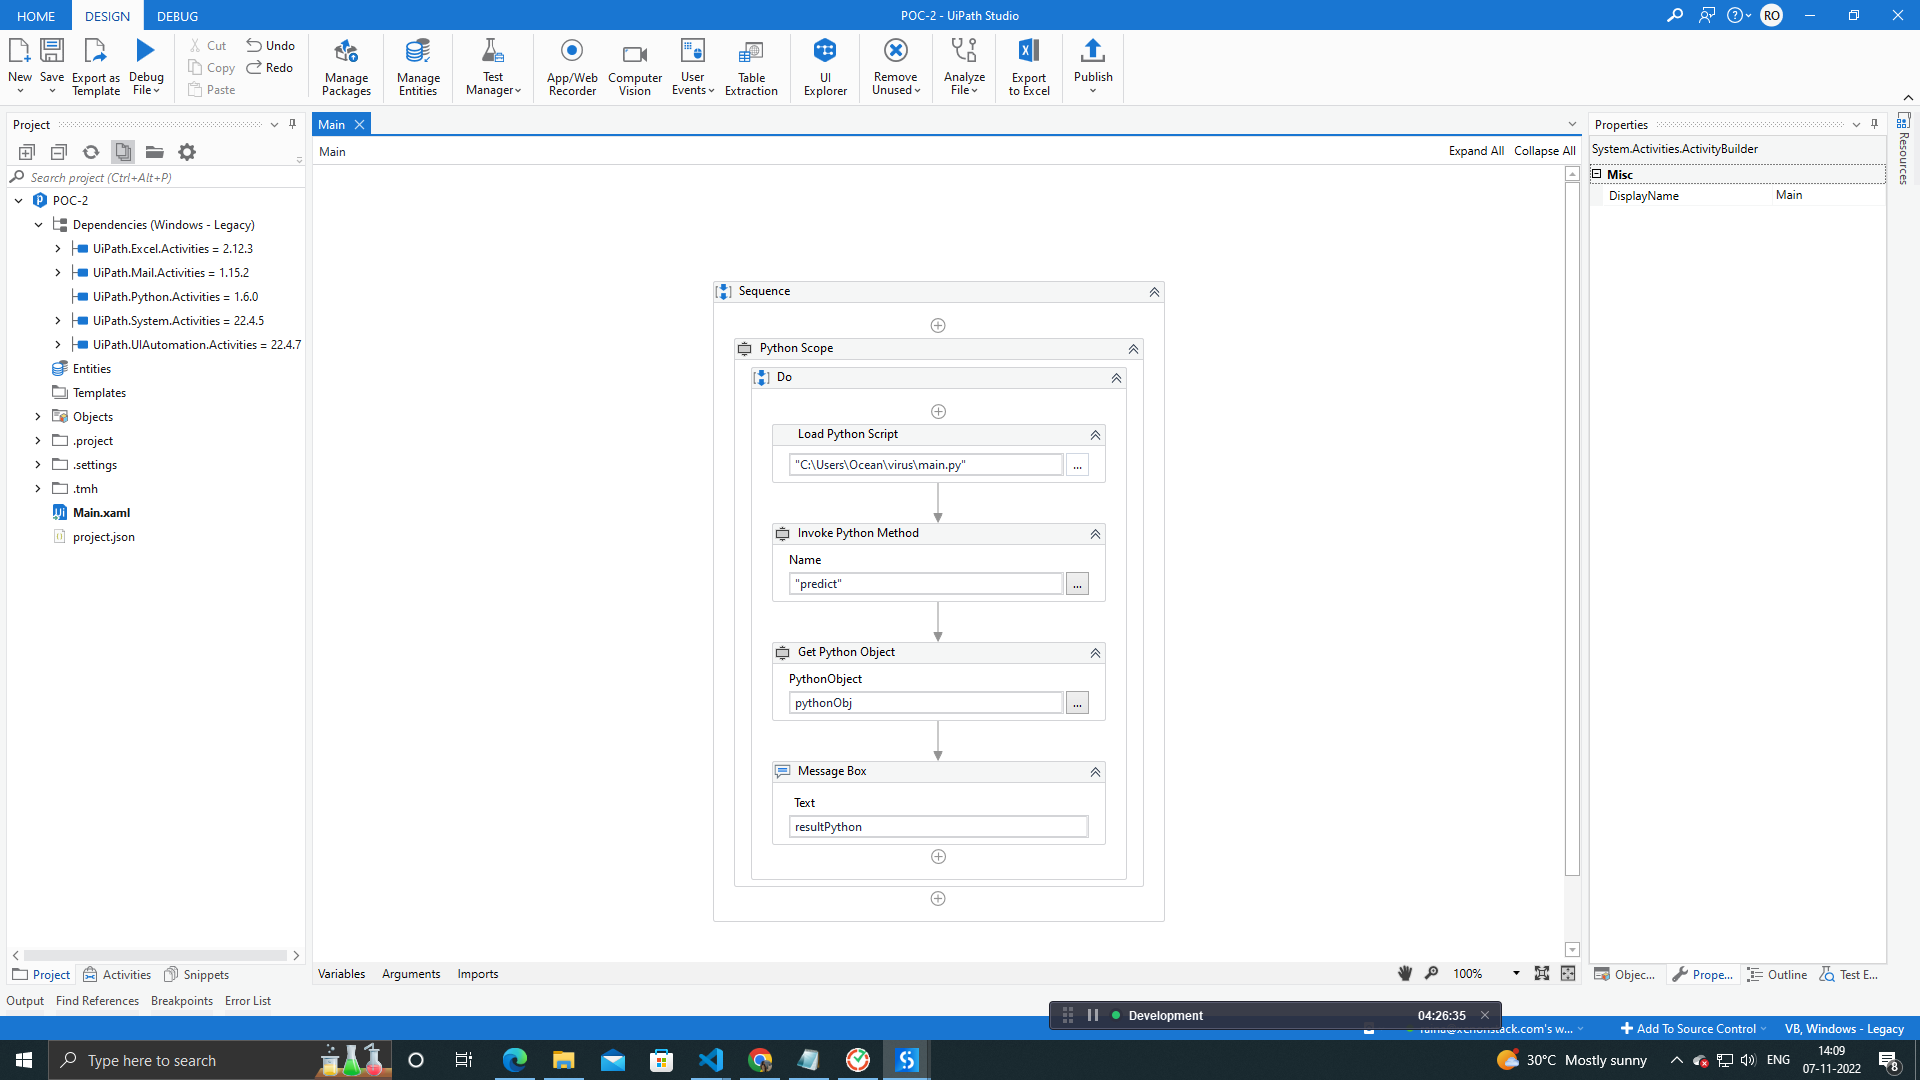
I need to create a visual diagram of my output in excel but i m stuck in between the flow i dont know how to proceed further , Any help will be useful to me .
Thanks & Regards ,
Hello @Raina_Ocean_Sanjay
Provide the Working Folder in the Python scope.
The working folder should be the path of the python script where you placed it.
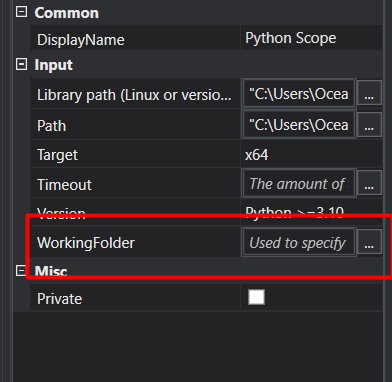
Yes i gave the path now , but i need to have a line chart in the excel .
Regards,
Did you check the python code, whether its working or not?
yes it is working properly ,
actually i want to know how to get the vs code output to uipath and create the excel line graph of it .