Hi,
I am having some issues designing a logic for summarizing this table in a more elegant way:
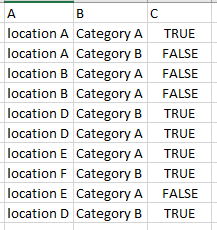
What I have are 3 columns,
Column A = Has values of 12 different locations
Column B & C = Has 2 possible values (Category A/B & True/False)
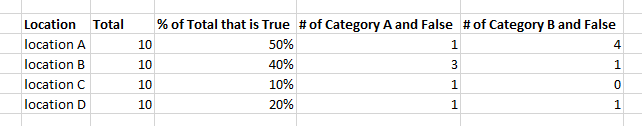
I need to output a summarized table which should ouput something like this:
Currently what I have is a large number of nested if statements (12, 1 for each location) which will be in a for each loop. Like so:
IF row(“Location”).ToString.Equals(“location A”)
THEN A_Total = A_Total + 1
IF row(“Category”).ToString.Equals(“A”) AND row(“C”).ToString.Equals(“False”)
THEN B_False = B_False + 1
everything else has the same logic.
I find this method too brute force and I have to deal with a large number of variables in which to keep track of. Is there an easier way to solve this?
EDIT: I also need to convert this datatable into html format in order to put it in a SMTP message activity
@anon5199880
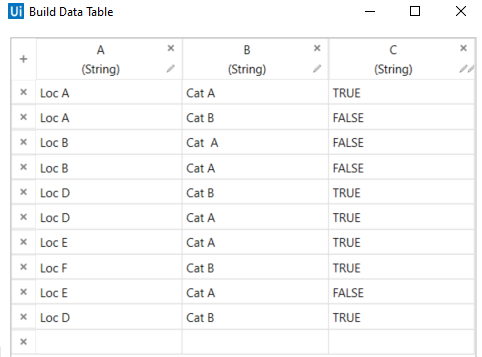
find starter help on a shortened data sample:
with a quick prototype LINQ (something adopted and some parts are to finalize) we can do following:
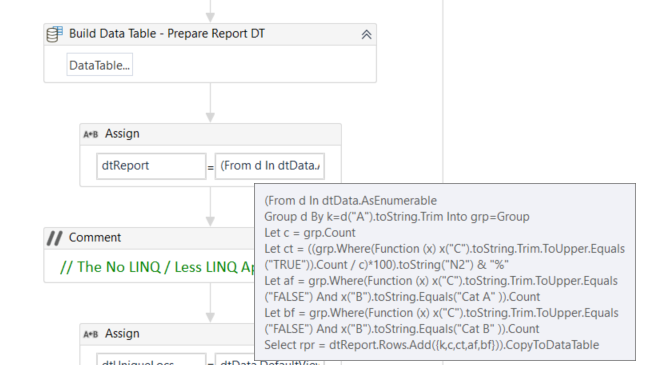
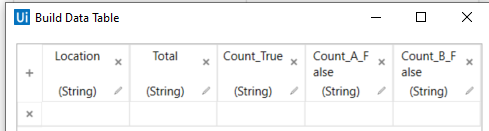
prepare the report datatable structure
fetch the data:
(From d In dtData.AsEnumerable
Group d By k=d("A").toString.Trim Into grp=Group
Let c = grp.Count
Let ct = ((grp.Where(Function (x) x("C").toString.Trim.ToUpper.Equals("TRUE")).Count / c)*100).toString("N2") & "%"
Let af = grp.Where(Function (x) x("C").toString.Trim.ToUpper.Equals("FALSE") And x("B").toString.Equals("Cat A" )).Count
Let bf = grp.Where(Function (x) x("C").toString.Trim.ToUpper.Equals("FALSE") And x("B").toString.Equals("Cat B" )).Count
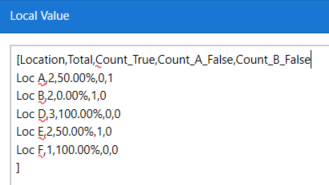
Select rpr = dtReport.Rows.Add({k,c,ct,af,bf})).CopyToDataTable
Result:
As an alternate we can also do it with less or no LINQ (See part implementation:)